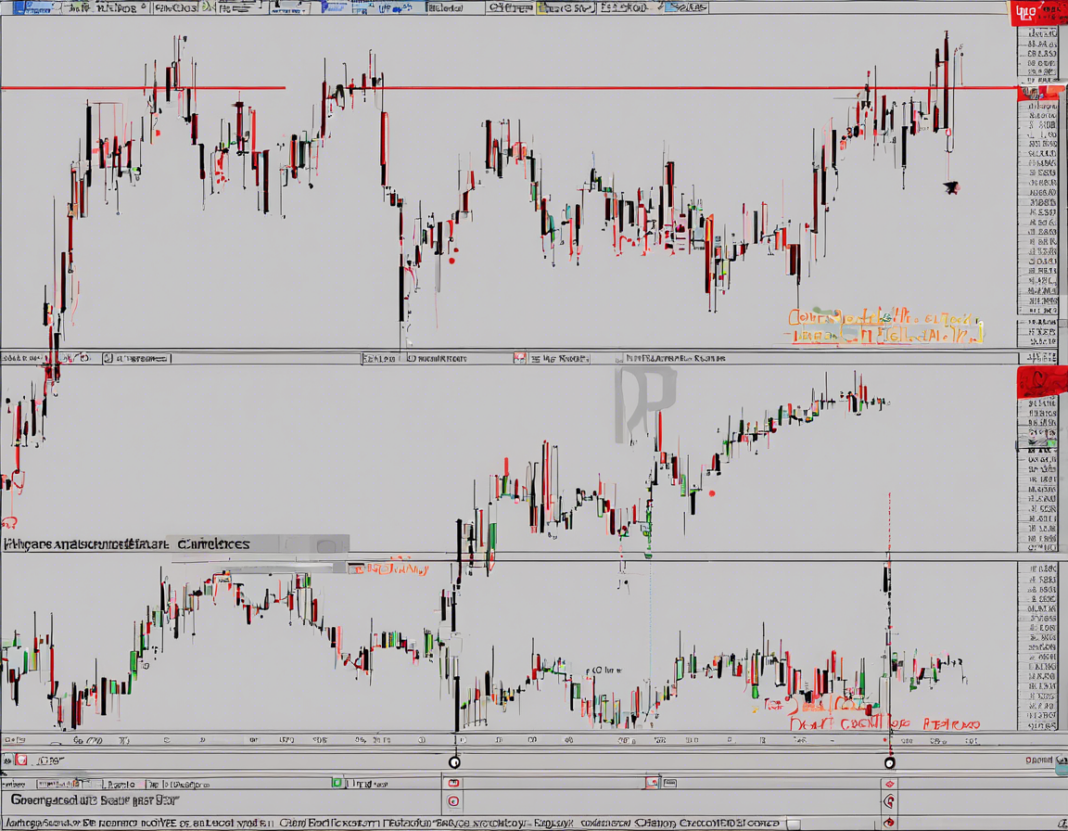
Candlestick patterns are graphical representations of price movements in the financial markets. They have been used for centuries by traders to predict future price movements based on past behavior. In this comprehensive guide, we will delve into the world of candlestick patterns, discussing their history, significance, and utility in modern-day trading. By the end of this article, you will have a solid understanding of how to interpret and utilize candlestick patterns in your trading strategies.
Understanding Candlestick Patterns
Candlestick charts originated in Japan in the 18th century and were popularized by renowned Japanese rice trader Homma Munehisa. Each candlestick on a chart represents the price action of an asset over a specific time period. The body of the candlestick indicates the opening and closing prices, while the wicks (or shadows) show the high and low prices during that period.
Common Candlestick Patterns
-
Doji: This pattern signifies market indecision, where the opening and closing prices are virtually the same.
-
Hammer and Hanging Man: Both these patterns have long lower wicks and small bodies, indicating potential reversals in price direction.
-
Engulfing Patterns: Bullish engulfing patterns occur during a downtrend and signal a potential reversal to the upside, while bearish engulfing patterns indicate a reversal in an uptrend.
Using Candlestick Patterns in Trading
Identifying Support and Resistance Levels
Candlestick patterns can help traders identify key support and resistance levels on a chart. Patterns like hanging man and shooting star near resistance levels can indicate potential reversals, whereas hammer and doji patterns near support levels may signal a bounce-back in prices.
Confirmation with Other Indicators
While candlestick patterns are useful on their own, traders often use them in conjunction with other technical indicators like moving averages, RSI, and MACD for confirmation. Combining multiple indicators can improve the accuracy of trading signals.
Setting Stop Loss and Take Profit Levels
Candlestick patterns can also help traders determine optimal stop-loss and take-profit levels. Placing stop-loss orders below key support levels in a downtrend or above resistance levels in an uptrend can help mitigate risk. Take-profit levels can be set based on the distance of the pattern’s projection, offering a favorable risk-reward ratio.
Common Mistakes to Avoid
-
Overlooking Timeframes: Different timeframes can yield conflicting candlestick patterns. It’s essential to consider the broader context and use multiple timeframes for confirmation.
-
Ignoring Volume: Volume provides additional confirmation of a price move indicated by candlestick patterns. A lack of volume support can weaken the validity of the pattern.
-
Failing to Adapt: Market conditions can change rapidly. Traders should be flexible and adapt their strategies based on evolving price action and news events.
Frequently Asked Questions (FAQs)
1. Can candlestick patterns be used for all types of trading assets?
Yes, candlestick patterns can be used across various trading assets, including stocks, forex, commodities, and cryptocurrencies.
2. How reliable are candlestick patterns in predicting price movements?
While candlestick patterns can provide valuable insights into potential price reversals or continuations, they are not foolproof. It’s essential to use them in conjunction with other forms of analysis for confirmation.
3. Are there specific candlestick patterns that are more powerful than others?
Some patterns, like engulfing patterns, morning/evening stars, and hammers/hanging man, are considered more powerful due to their significance in signaling trend reversals.
4. Can beginners effectively use candlestick patterns in their trading strategies?
Yes, beginners can start by learning a few key patterns and practicing on demo accounts before implementing them in live trading. It’s important to combine pattern recognition with risk management strategies.
5. How can traders stay updated on the latest candlestick patterns and market trends?
Traders can use various resources like trading books, online courses, webinars, and financial news outlets to stay informed about new patterns and market developments.
6. Do candlestick patterns work better in trending or ranging markets?
Candlestick patterns can be effective in both trending and ranging markets. In trending markets, they can signal potential reversals, while in ranging markets, they can indicate breakout or breakdown levels.
7. Are there automated tools that can help identify candlestick patterns?
Yes, there are several trading platforms and charting software that offer automated pattern recognition tools. These tools can scan multiple assets and timeframes to identify potential setups.
8. How can traders backtest candlestick patterns to assess their effectiveness?
Traders can backtest candlestick patterns by analyzing historical price data and comparing the outcomes of trades based on specific patterns. This helps in evaluating the reliability and profitability of using these patterns.
9. Can candlestick patterns be used in combination with fundamental analysis?
Yes, traders often combine technical analysis, including candlestick patterns, with fundamental analysis to make well-informed trading decisions. Fundamental factors like economic data, earnings reports, and geopolitical events can influence price movements.
10. Are there any online communities or forums where traders discuss and share insights on candlestick patterns?
Yes, there are several online trading communities, forums, and social media groups where traders exchange ideas, analyze candlestick patterns, and discuss their trading experiences. Participating in such communities can provide valuable learning opportunities.
In conclusion, understanding and mastering candlestick patterns can significantly enhance your trading skills and decision-making processes. By integrating these patterns with other technical and fundamental analysis tools, traders can gain a clearer perspective on the financial markets and improve their overall trading performance.Continuous learning, practice, and adaptation to market dynamics are key to effectively applying candlestick patterns in your trading strategies.


